Statistic
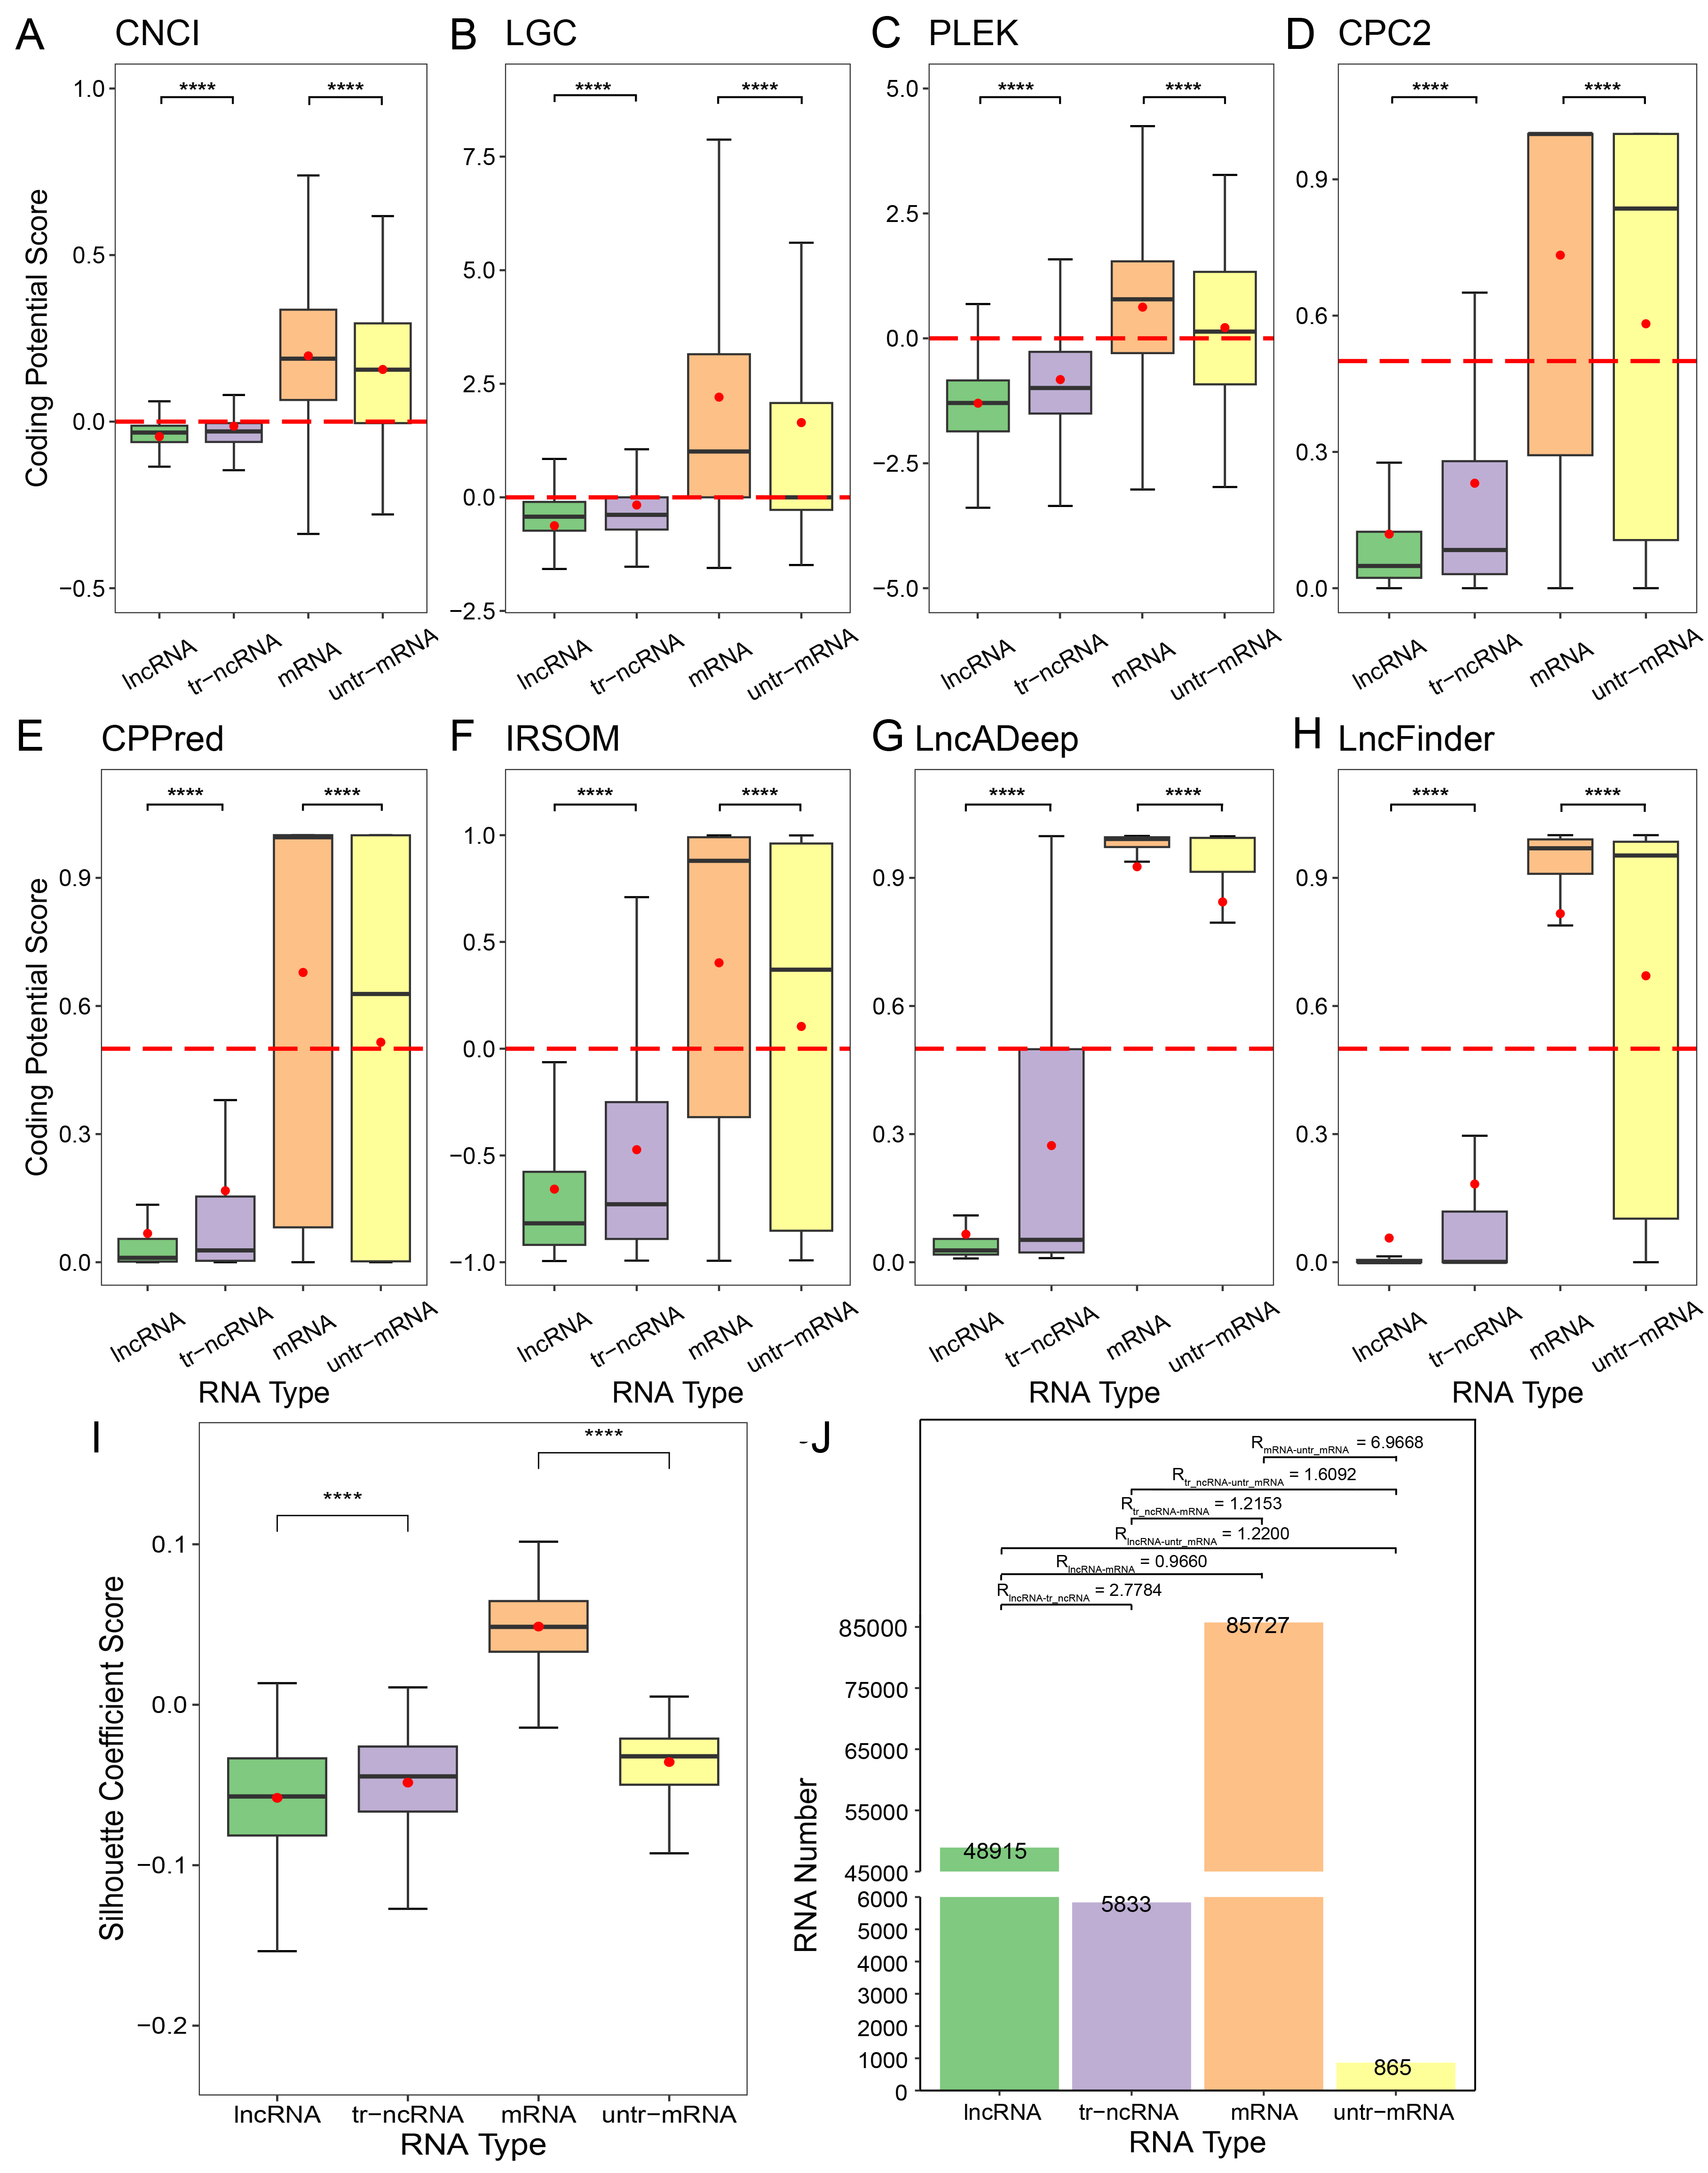
A~H, Coding potential scores of lncRNA, tr-ncRNA, mRNA, and untr-mRNA in human calculated by 8 tools. Red dash lines is the cutoff value of coding for each tool. Red dots represent the mean values of coding potential scores. These four type of RNAs are regarded as four clusters.
The silhouette coefficient scores, amount of RNAs and the R(i,j)
are showed in picture I and J separately.
The number of each type of RNAs is marked on the top of the bar
and R(i,j) between each two types of RNA is marked above the bar.
The Mann-whitney U test is used to assess the result significance among groups. The **** represents the p-value from 0 to 0.0001.
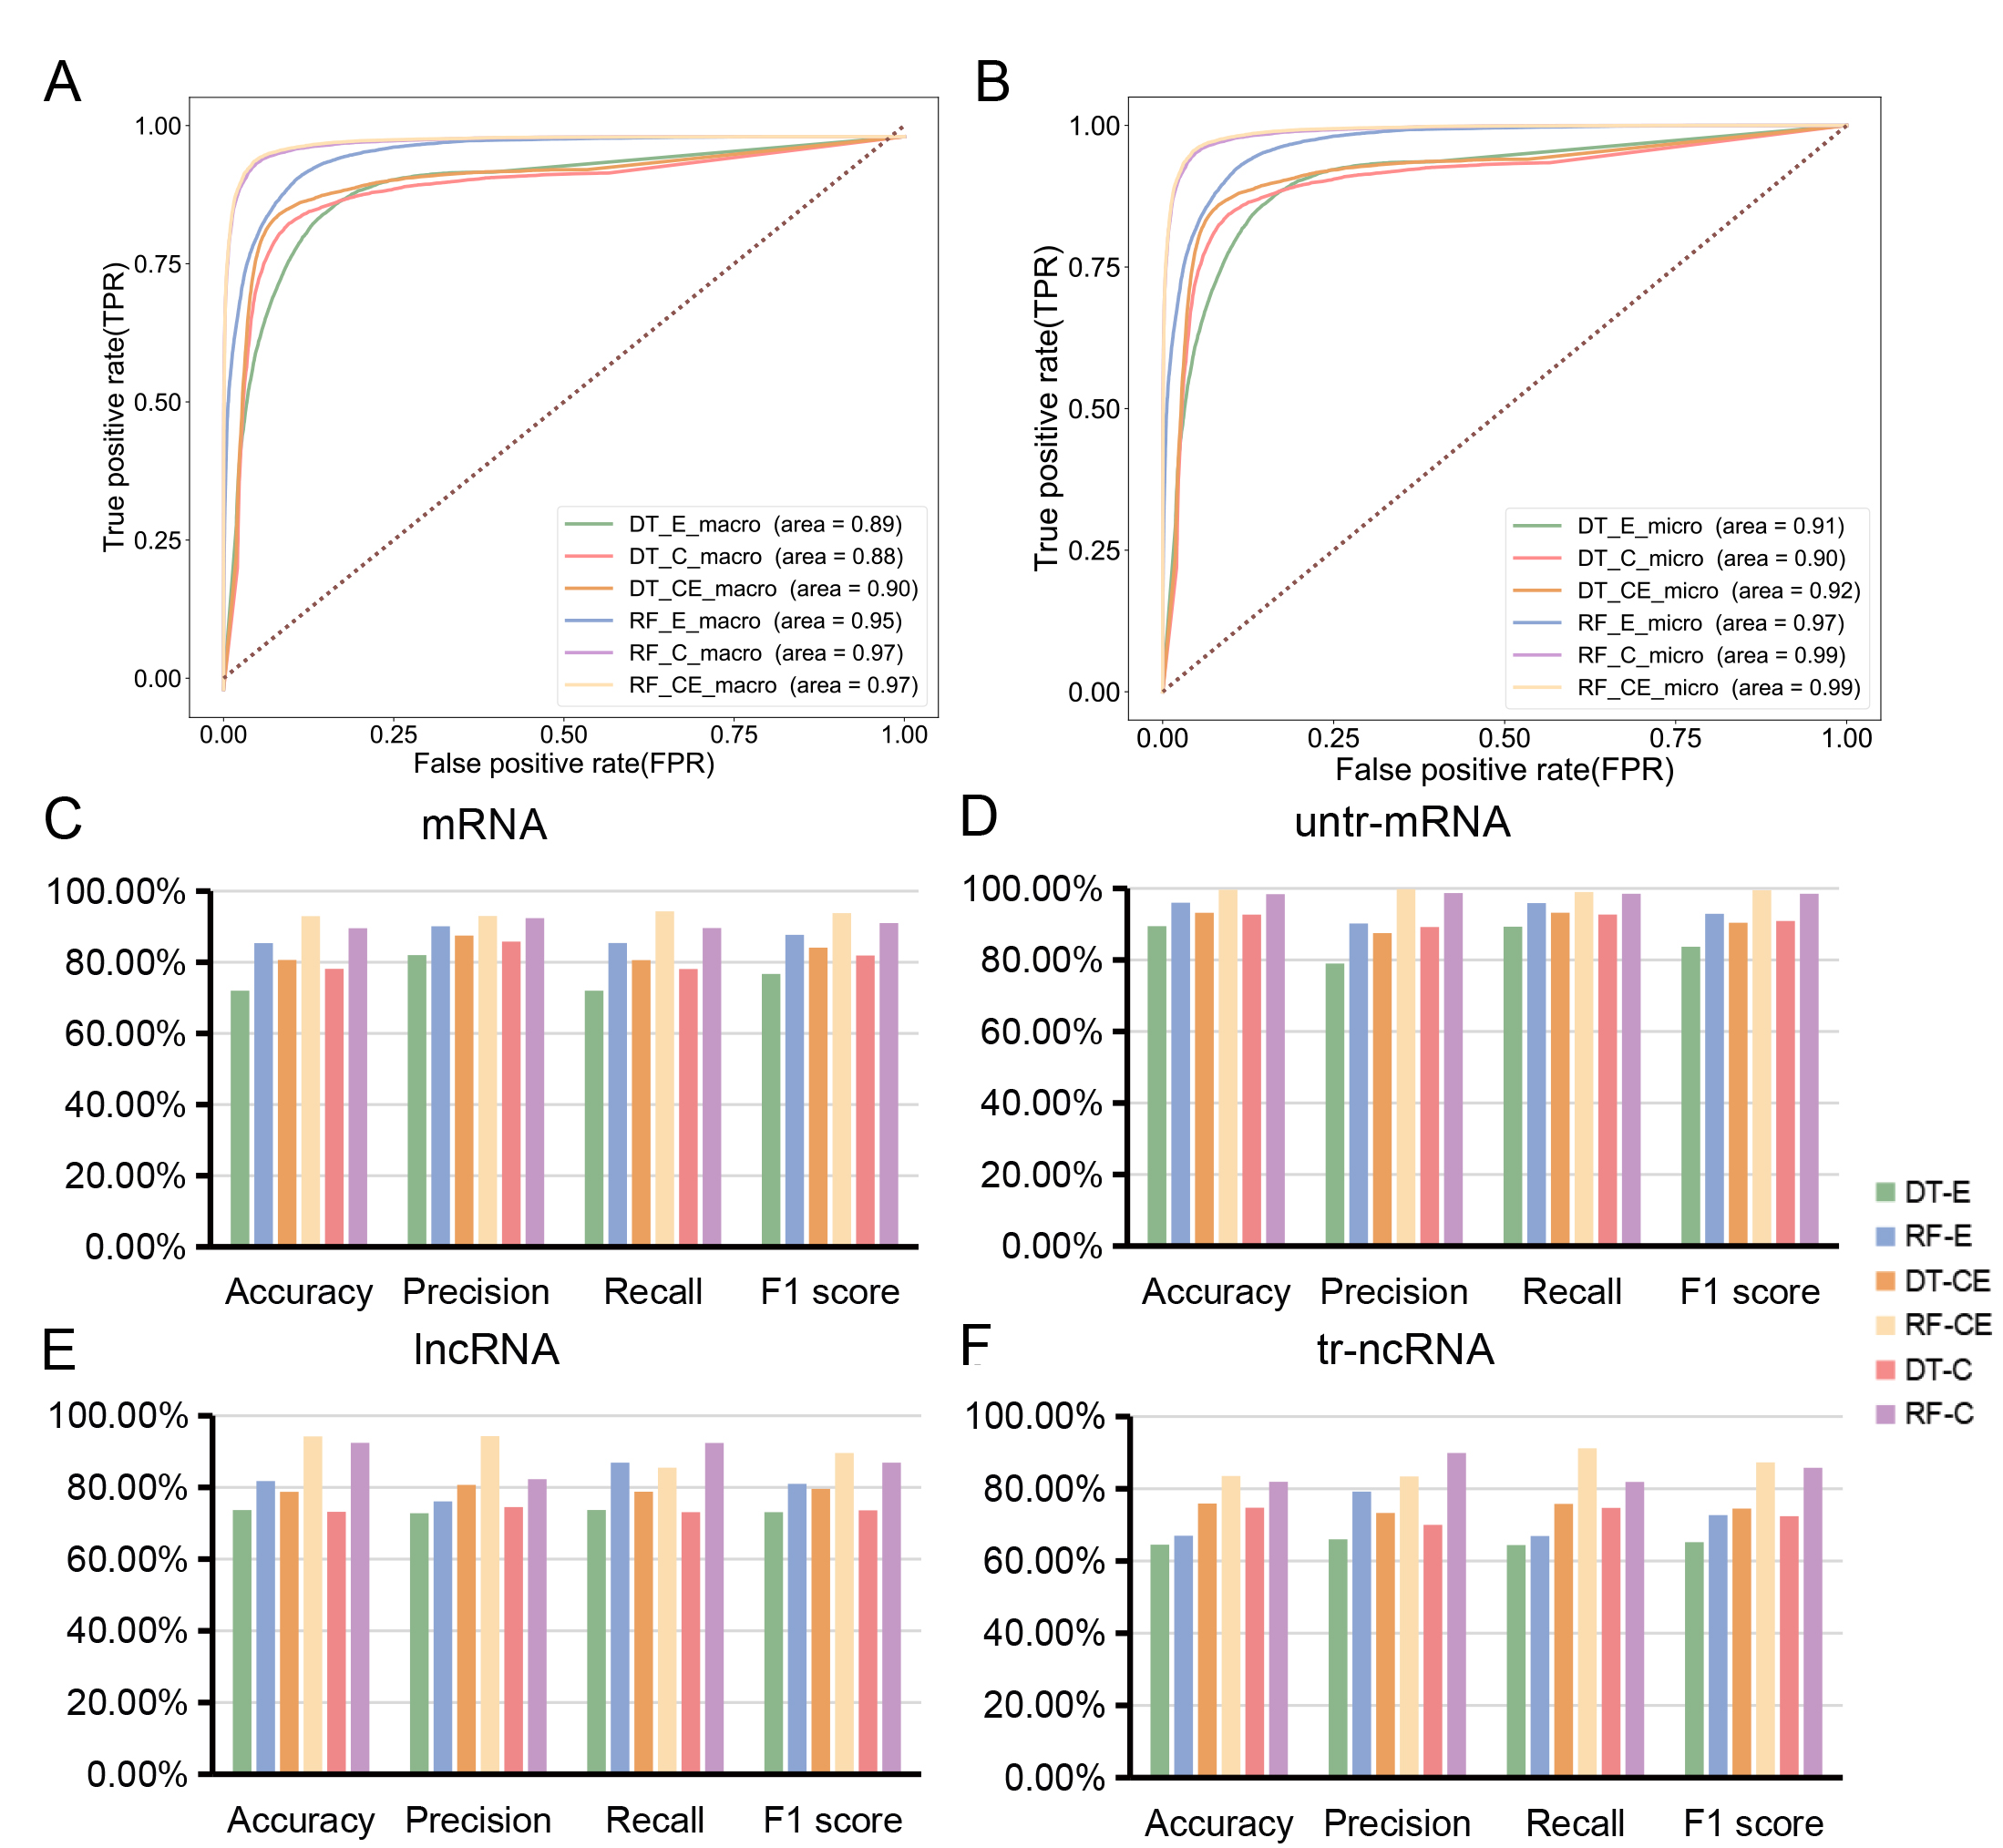
A, Macro average ROC curve of six models.
B, Micro average ROC curve of six models.
C~F, Accuracy, precision, recall and f1 score of DT-E model,
RF-E model, DT-C model, RF-C model, DT-CE model and RF-CE model in four types of RNAs.
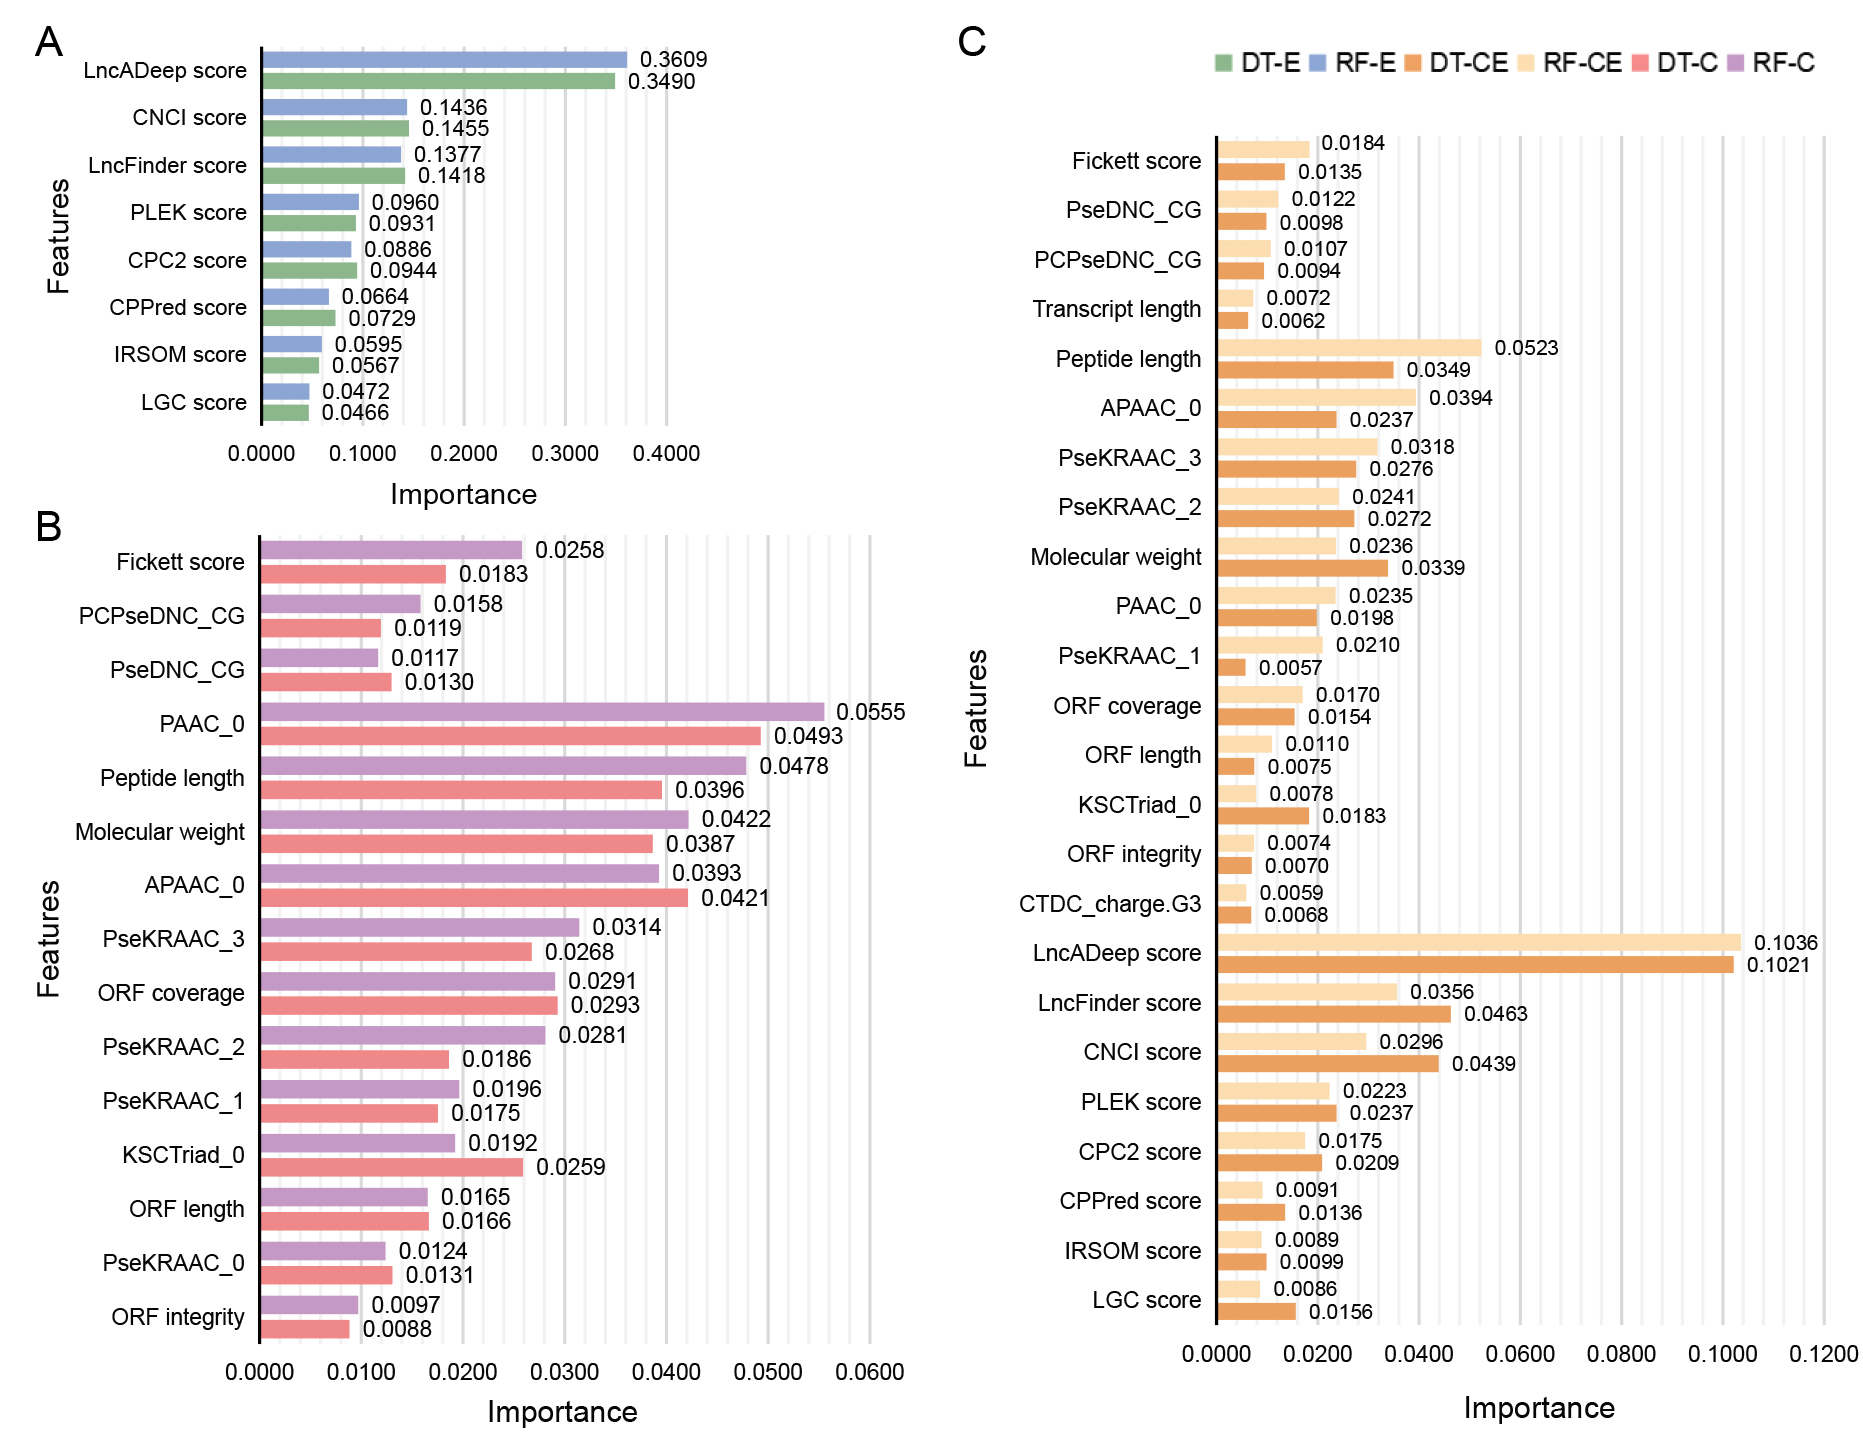
A, Top 8 features in DT-E model and RF-E model.
B, Top 15 features in DT-C model and RF-C model.
C, Top 24 features in DT-CE model and RF-CE model.
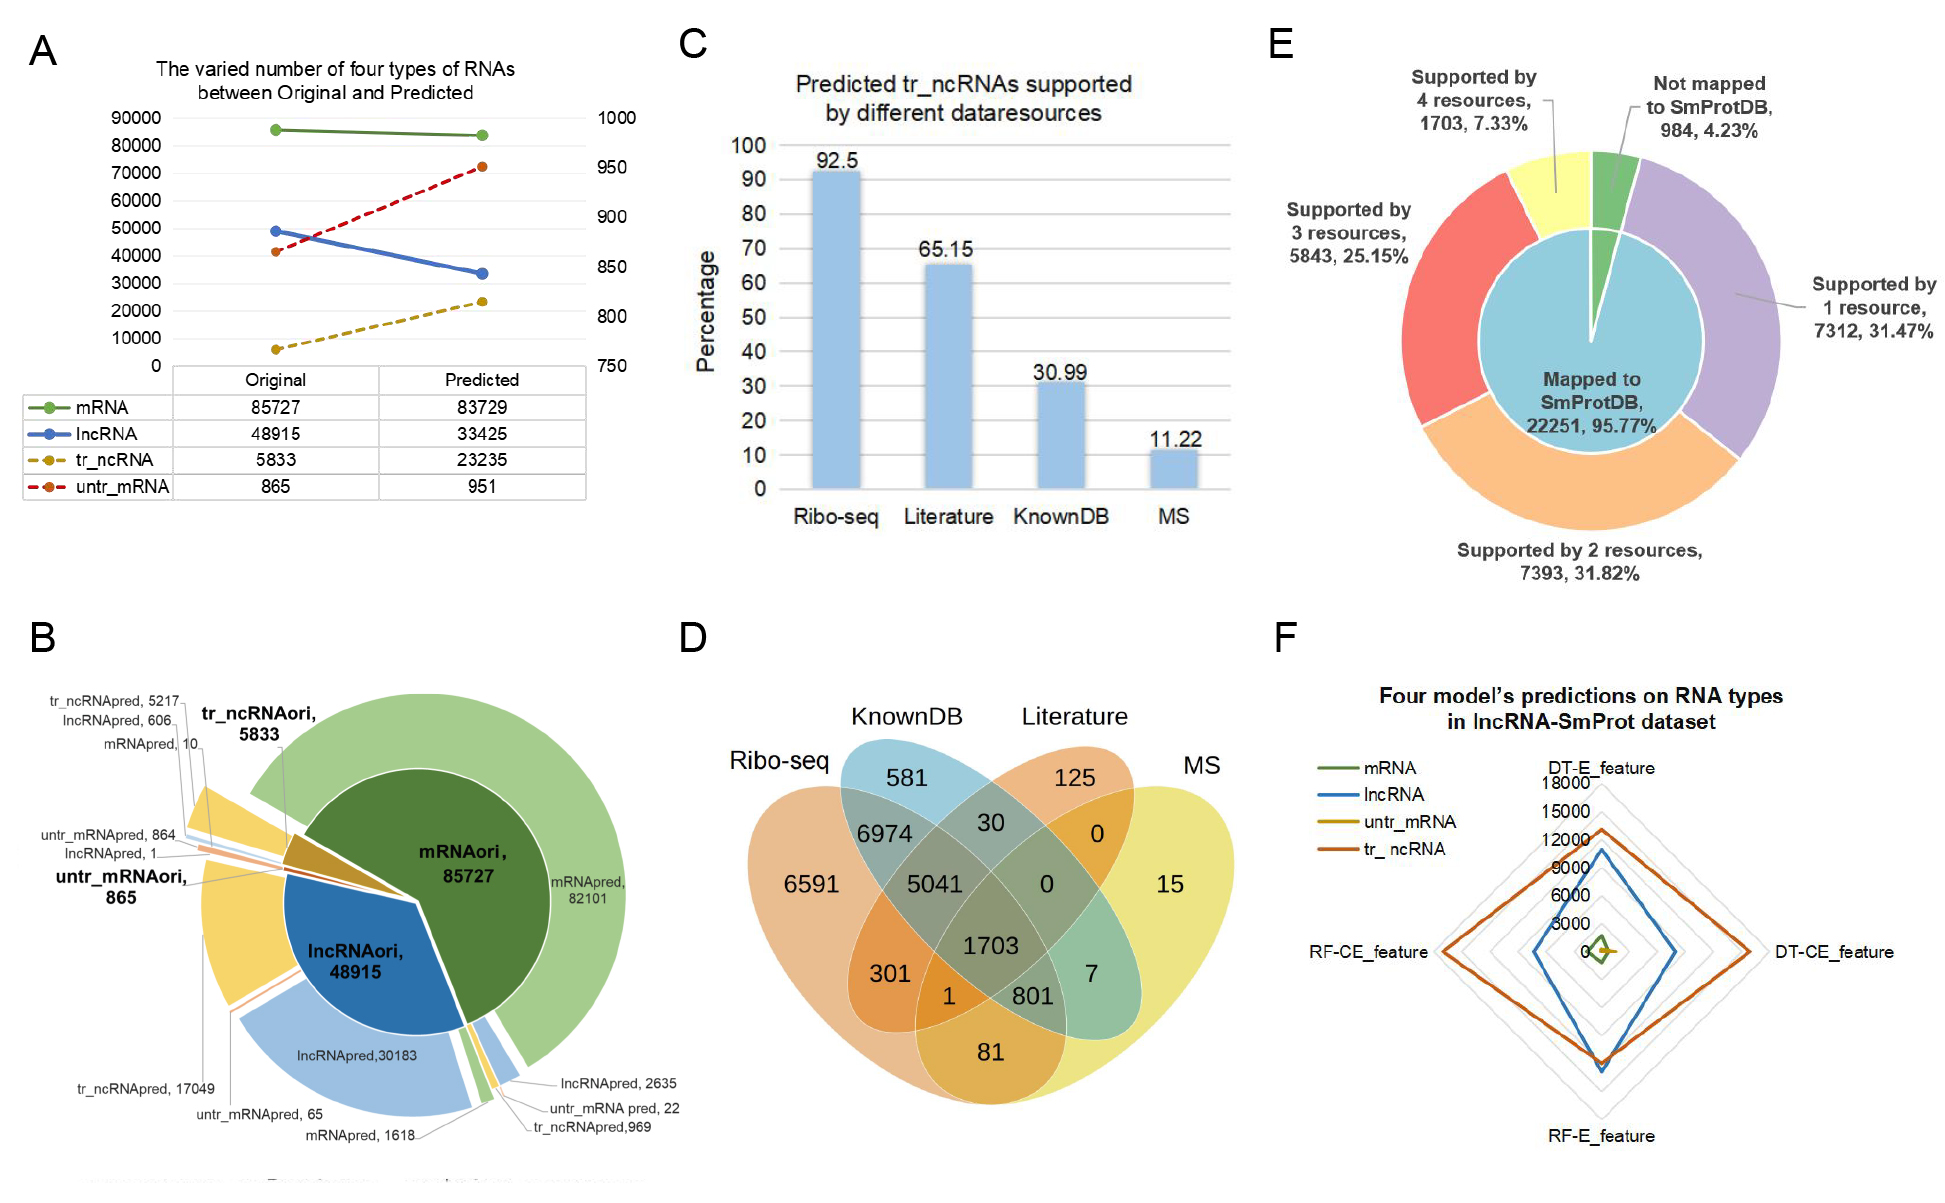
A, The varied number of four types of RNAs between original and predicted.
B, Prediction results from RF-CE model on RNA types in raw datasets.
C, The proportion of predicted tr-ncRNA supported by small proteins from ribo-seq profiles, known database (knowndb), literature mining results and mass spectrometry (MS) separately in SmProt database are showed in the histogram.
D, The venn chart shows the number of predicted tr-ncRNA supported by small proteins from ribo-seq profiles, knowndb, literature mining results and MS in SmProt database.
E, The small pie chart shows the number and proportion of predicted tr-ncRNA which mapped / not mapped to SmProt database. The number and proportion of predicted tr-ncRNA supported by small proteins from one to four resources (ribo-seq profiles, knowndb, literature mining results and MS) are showed in the big pie chart. The first number represented the RNA number and the next number represented the proportion.
F, The radar chart shows the number of each predicted type of RNAs via different models in lncRNA-SmPort dataset.
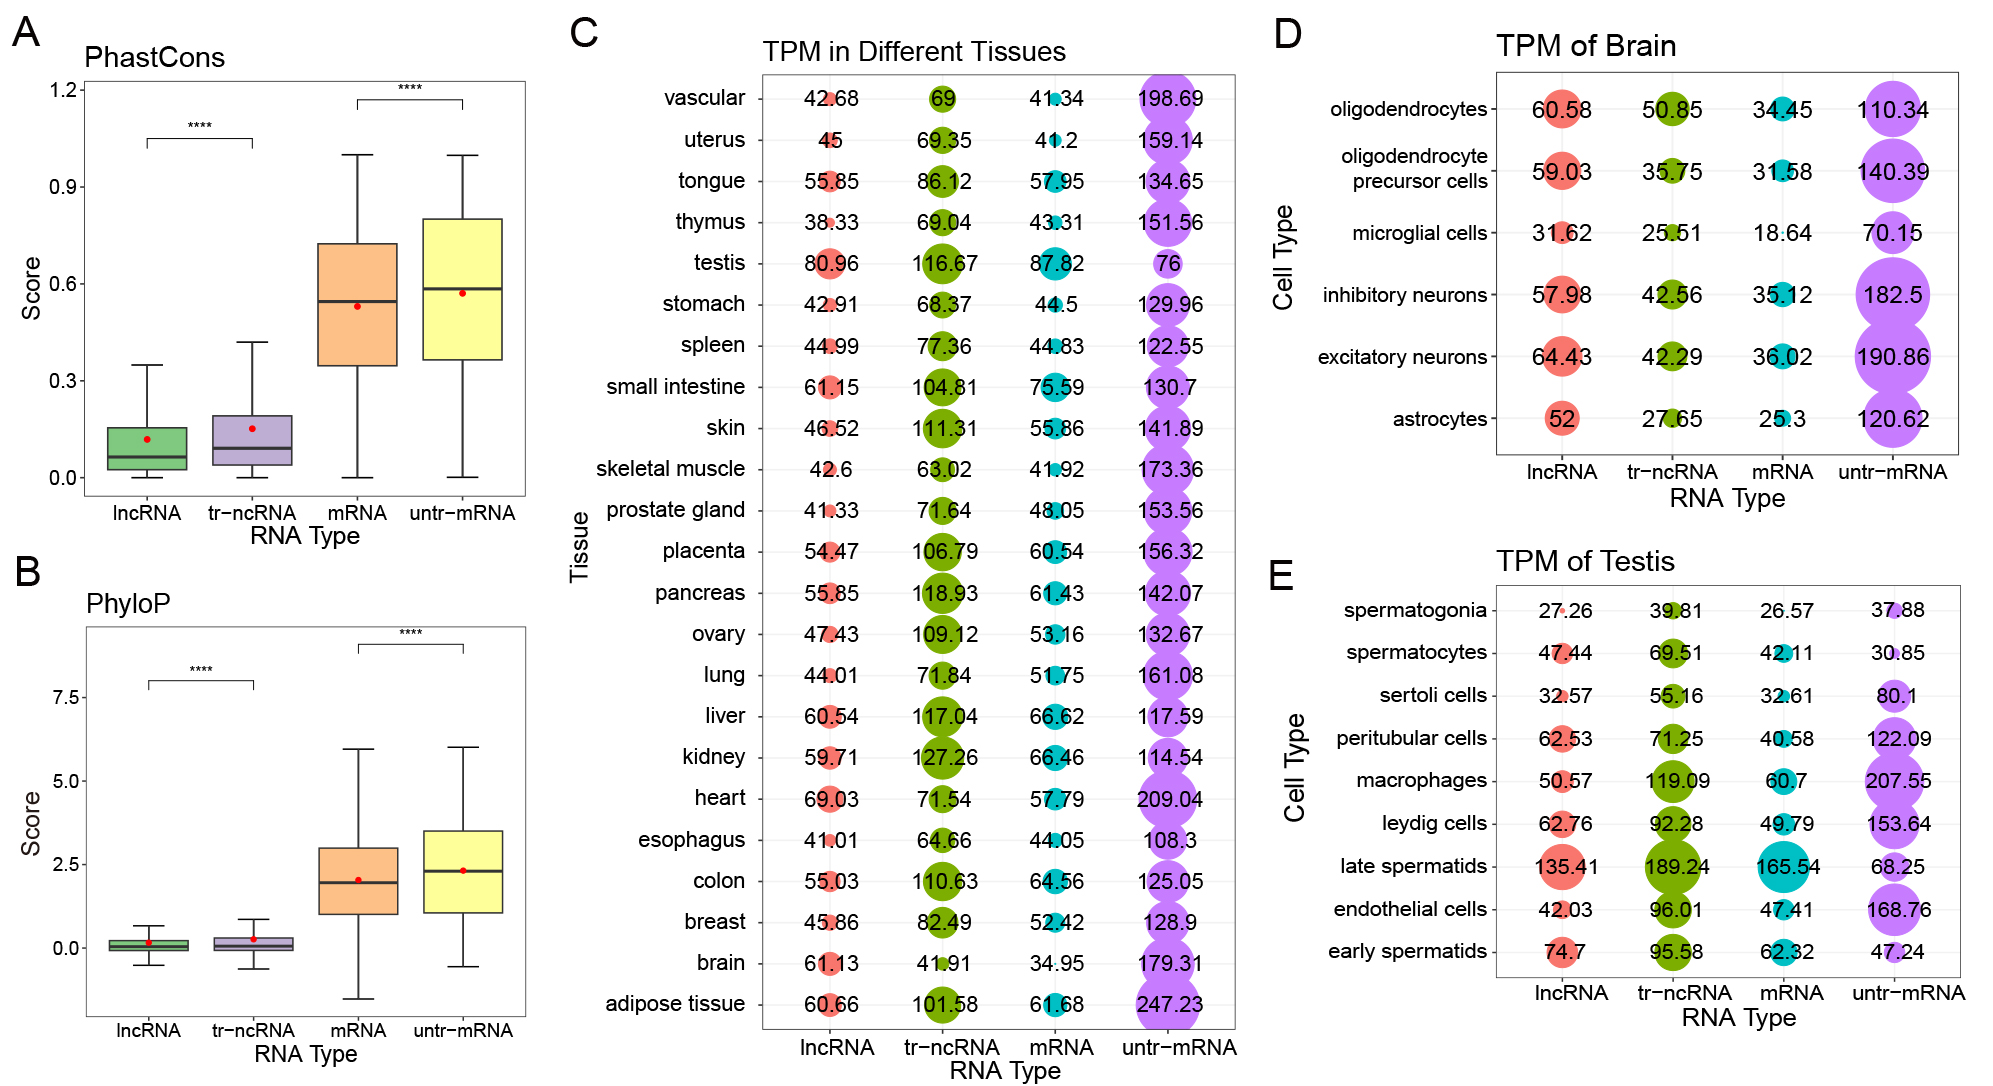
A, The scores of PhastCons and
B, PhyloP of human lncRNA, tr-ncRNA, mRNA, and untr-mRNA. The higher score represents higher conservation.
C, Expression level of human lncRNA, tr-ncRNA, mRNA, and untr-mRNA in testis by scRNA-seq.
D, Expression level of human lncRNA, tr-ncRNA, mRNA, and untr-mRNA in brain by scRNA-seq.
E, Expression level of human lncRNA, tr-ncRNA, mRNA, and untr-mRNA in 23 tissues by scRNA-seq. The dots and the numbers represent the TPM values of RNAs. The bigger the dot, the higher the TPM.
The Mann-whitney U test is used to assess the result significance among groups. The **** represents the p-value from 0 to 0.0001.
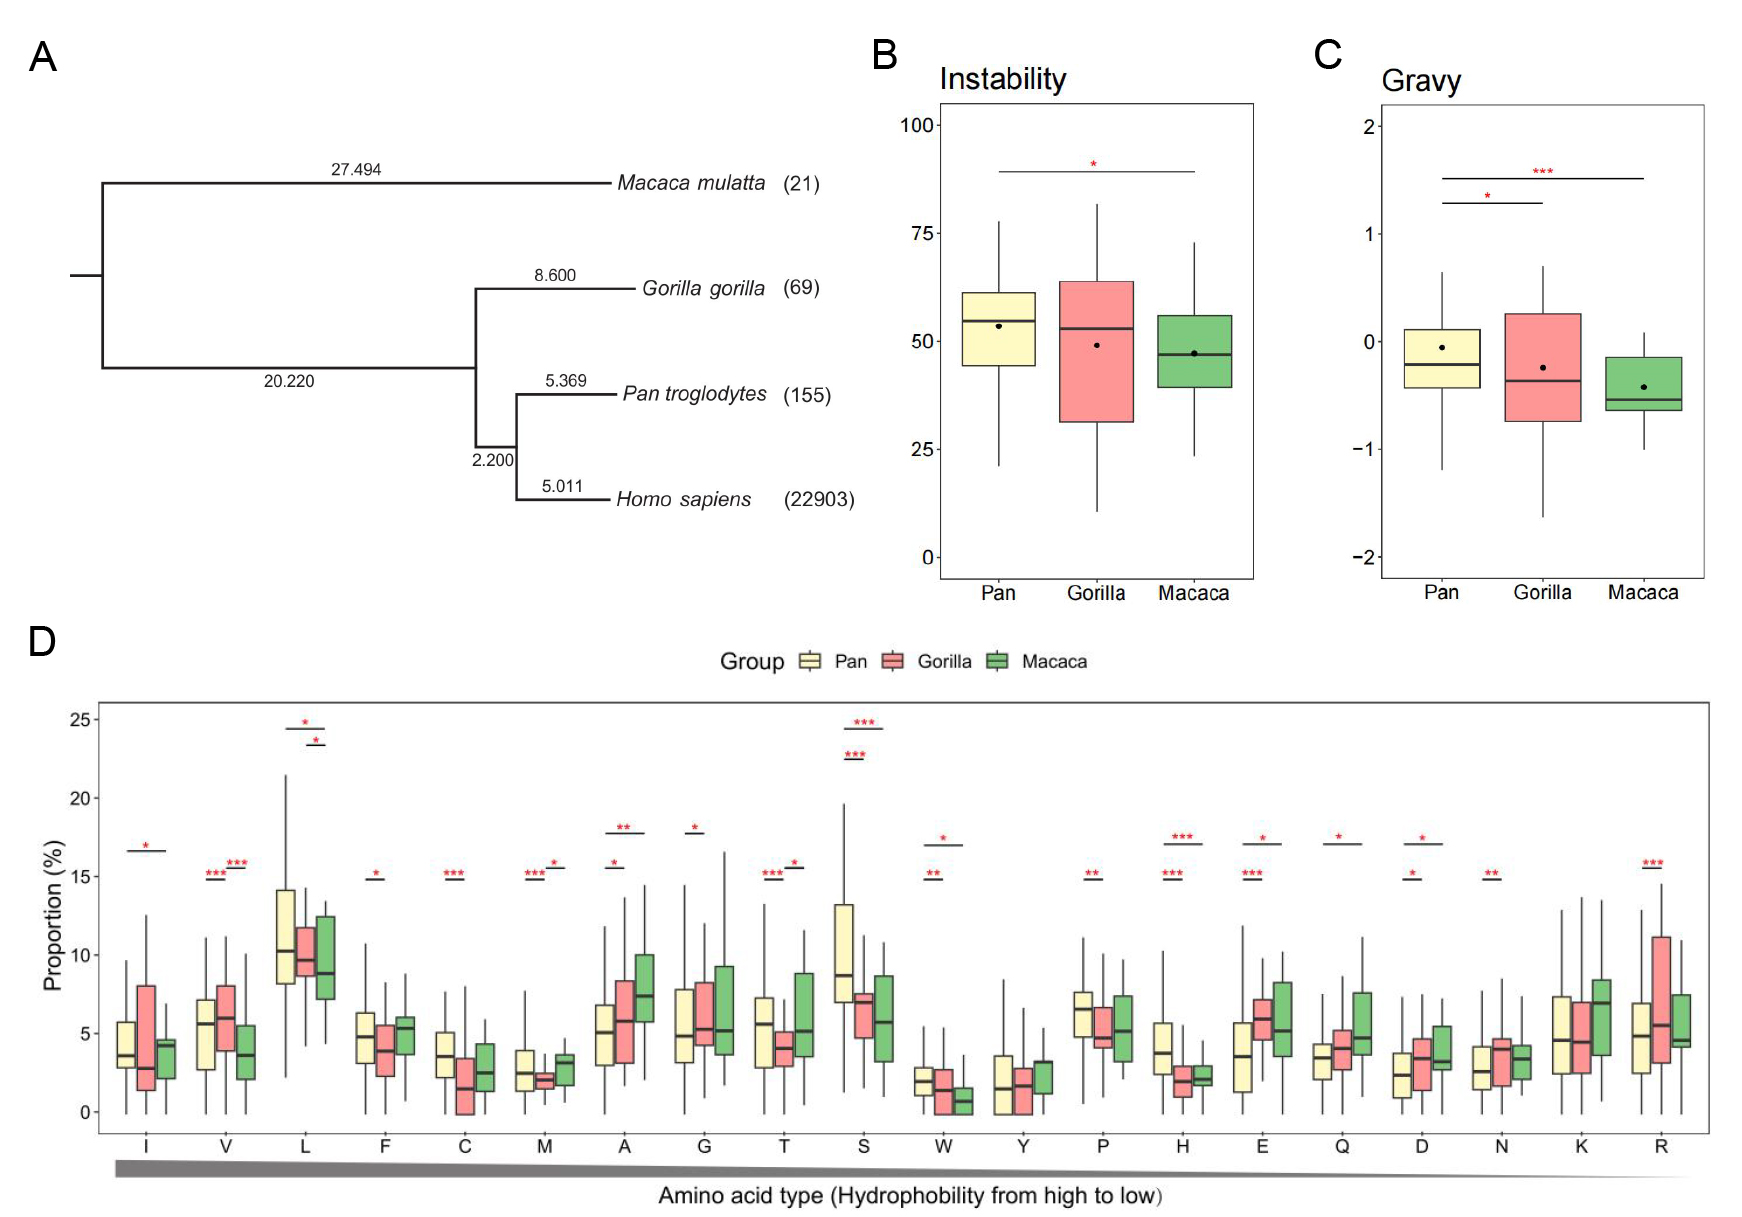
A, Taxon tree of four species. The evolution time (MYA) is marked on the branch. The number after the species name is the amount of conserved tr-ncRNAs.
B,The Instability indices of small proteins coded by tr-ncRNAs.
C, The Gravy values of small proteins coded by tr-ncRNAs.
D, The proportion of 20 types of amino acids sorted by the hydrophobility. Human tr-ncRNAs divided in different groups are represented by different colors.
The t test is used to assess the result significance among groups. The *** represents the p-value from 0 to 0.001, ** represents the p-value from 0.001 to 0.01, and * represents the p-value from 0.01 to 0.05.
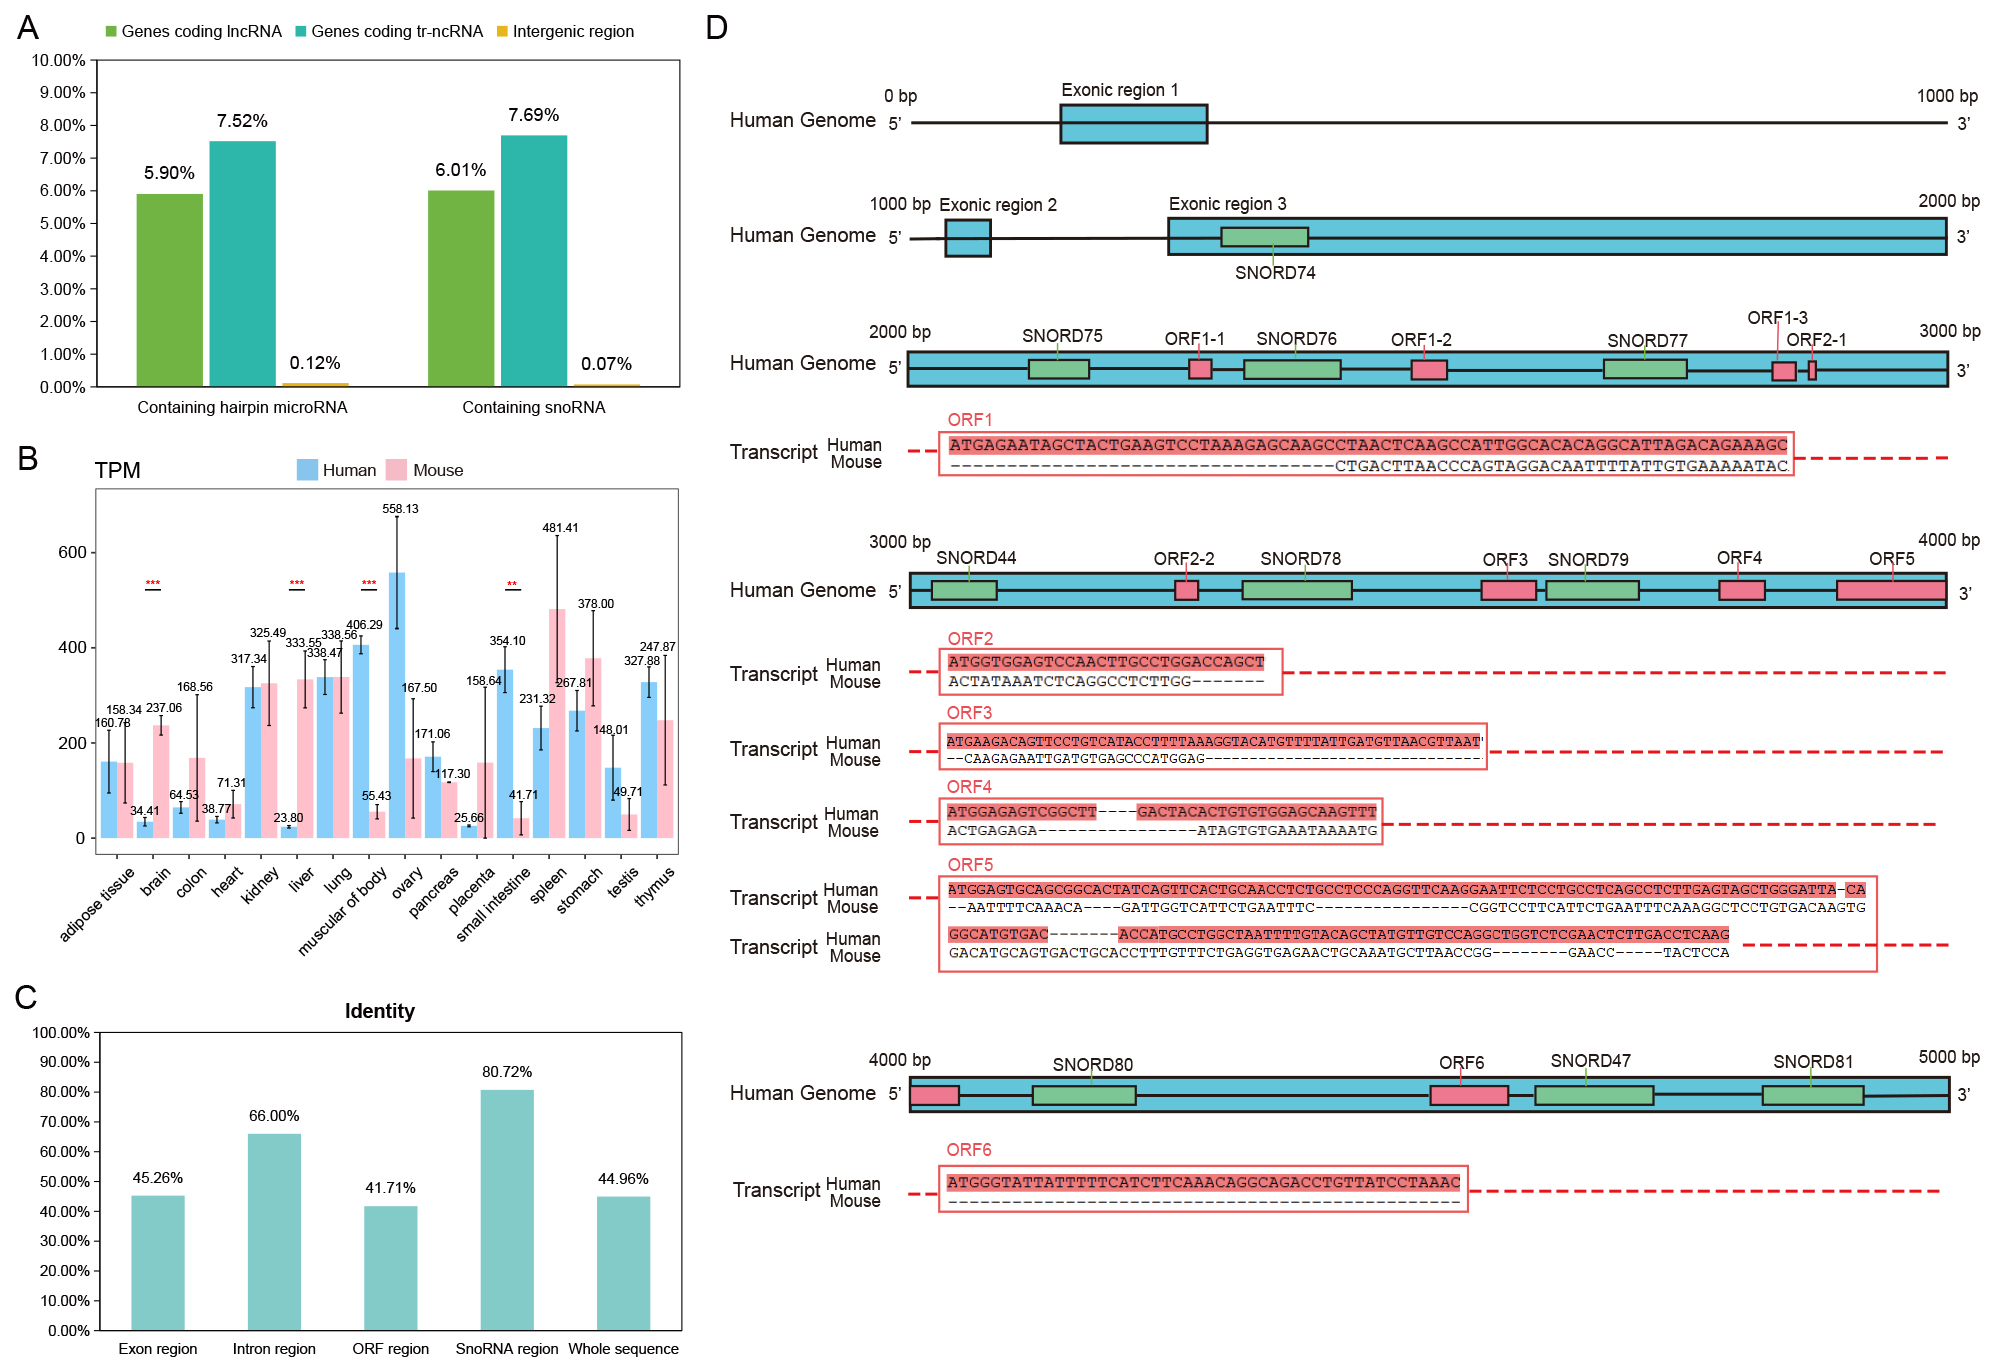
A,The proportion of tr-ncRNA, lncRNA and intergenic regions mapped to microRNA and snoRNA.
B,Expression level of human and mouse homologous genes in different tissues.
The t test is used to assess the result significance among groups.
The *** represents the p-value from 0 to 0.001, ** represents the p-value from 0.001 to 0.01.
C, Identity of different regions in human and mouse homologous gene sequence alignment.
D, Schematic diagram of human and mouse homologous gene sequence alignment. The blue boxes represent exons of genes, the red boxes represent ORF regions, and the green boxes represent snoRNAs.
The alignment results of the ORF regions of transcripts are shown in the figure.